
B2B SaaS sales modeling
Our third blog will focus on a common challenge that we have identified as a recurring theme in our current and potential investments. How to model new customer acquisition in B2B SaaS sales, and what we have noticed that is often neglected while modeling. The blog’s goal is to provide insight for sales organizations to improve their sales budget planning. If you can include all the presented factors (and the missing ones / your own), we believe you are on the right track in improving your sales organization. Finally, there is a B2B SaaS sales model that we have created for two sales organizations that you can ask for free. The model has been field-tested and deemed as an excellent tool by both organizations.
Multiple parameters are missing from our model and this article. We realize that a single post can not provide a tailor-made solution for every organization, and thus the model is a generalization. However, with some creativity and adding your parameters, you can get realistic estimates of the future. Furthermore, if you are interested in B2B SaaS Sales strategies, check this link out or this one. You might find both useful. They are pretty lengthy reads but worth it!
Before moving on
We want to address four crucial matters that might be very obvious but at times forgotten. First, when doing budget planning, try to base your assumptions on concrete numbers as much as possible. For many, this might mean taking historical averages. However, when you can not use historical data, try to justify each assumption realistically. Unrealistic assumptions are meaningless to work with. Second, plug in your actual numbers and compare them with your model’s estimates. You can then deduct if your expectations are realistic and your model is a good predictor. Third, always build a model bottom-up instead of top-down. Fourth, exercise caution and apply the principle of prudence while modeling, just like in accounting.
Useful acronyms moving on:
AD: Account Director
AM: Account Manager
KAM: Key Account Manager
SDR: Sales Development Representative
Average Employment Tenure
The first essential parameter we think of is the average employment tenure of sales staff. Employers often mention the desired employment tenure for the position in the job advert. This usually ranges from three to ten years. While such a period is, in our opinion, somewhat optimistic, let’s start working with 36 months. To account for sales staff’s average employment tenure, we have to “churn” the sales staff each month, i.e., if you have one account manager and your typical employment tenure is 36 months, you must churn your salesforce by 1 / 36 every month. You are, in a way losing a portion of the staff each month.
This might seem unrealistic at first, but it makes sense when applied to a larger organization. For example, think of a sales department with 40 sales staff. If your average employee tenure is 36 months and you hire them at month x, will they all leave at month (x + 36)? There is a constant leakage of staff getting headhunted, changing industry, maternity leave, etc. spanning before and after the x + 36 months.
Furthermore, all budgets should consider that around 10 – 25% of the recruits will leave after their trial period (or not offered a permanent position). This is another “churn” component of your budget, and if it does not come up in the plan, you are assuming that 100% of your recruits will be “permanent” employees. Does this seem unrealistic? To us, it does.
Ramp-Up Time
Secondly, we want to talk about ramp-up time that is often missing. To our experience, models have the amount of AM’s, KAM’s, or AD’s for their budgeting but often miss the ramp-up time of new sales staff. This causes models to show overly optimistic levels of sales per sales staff. If ramp-up time is not introduced and salesforce adequately calculated, you value a senior AM and a new AM at the same level.
When ramp-up time is included in budgeting, you account for the new sales staff’s learning curve. Our intuition is that every new employee has to know the company and build confidence in the product, the team, the management, and the ability to close deals. There are significant individual and company level differences in how fast a new employee will catch up with the senior employees in sales levels. For that, you should pay close attention to how fast your average recruit (those that do not leave after the trial period) catches your senior sales staff.
Salesforce & SDRforce
So far, we have talked about employee churn and ramp-up. It all comes together when calculating your salesforce. In our opinion, organizations should distinguish between sales staff and salesforce. The difference is that sales staff represents precisely how many sales staff you have while salesforce means the sales capability of your current sales staff. The salesforce calculations are pretty straightforward when using the employee churn and ramp-up. Take your existing sales staff and start “churning” them by the average lifetime of your sales staff. Once a new sales recruit joins the team, assume that within x months, he will perform like a “full-time” employee. Furthermore, include that y percentage of your recruits will leave after their trial period. You will probably have a reasonably accurate estimation of your true sales power if you can justify all the assumptions for salesforce calculations using past data.
At this point, it is essential to note that if you have different types of sales staff, e.g., AM’s, KAM’s, and AD’s, remember to normalize one of them and give relative sales expectation weights to the others in comparison. The logic here is that (if we normalize AM’s to 1), the Key Account Managers might be responsible for large clients, and thus, the expectation for a KAM is to sell at a rate of 1.7 to an AM.
SDRforce is essentially the same as salesforce, except for your SDRs. Just follow a similar approach as when calculating the salesforce, and you will find an estimation of your SDR capabilities. Note here that not all organizations require cold or warm pre-revenue driving activities. It depends on how your organization is structured.
Capacity, Conversion & Net Signed ARR
Using the salesforce and SDRforce, you can now estimate the capacity of your sales organization, i.e., how many calls and meetings the organization can handle at any given month. While you have evaluated your organization’s capacity, assessing the conversion from contact to sales is also essential.
The conversion rate is a very usual metric that sales managers and highly successful sales executives follow. When building your model, try to distinguish hot and cold leads from your previous data, and how many of these leads convert to a meeting. This way, you can compare the average conversion rate between these two categories. Once you have made the separation, use the past conversion rates as your estimates of future conversion rates. Now you can calculate how many meetings you are theoretically able to book in a month and compare it with your meeting capacity.
Finally, we will estimate how many meetings lead to a sale. Before calculating the Net Signed ARR, it is meaningful to consider two missing factors: the lagged sales and sales lost during the trial. Trial period loss is evident. A certain percentage of your sales will reconsider and change their mind about buying your product. It is entirely natural, and every organization will face this at times. If the percentage becomes significant, try to find why such behavior occurs. Our intuition in lagged sales is that there is a period between the sale, invoicing, and onboarding process once a meeting turns out to be a sale. The lag causes cash flow imbalances for the company: costs incur immediately while cash flows can be delayed even up to a year (or even more).
Once you have estimated your trial churn and sales cash flow lag, you can approximate the Net Signed ARR at any given month. Here is an example that clarifies the calculations. Let’s say that 10% of your new customers start using and paying within the month of the sale, and you have ten sales per month with 6000€ per annual license. So the Net Signed ARR of month 0 would be 600€.
Cost Estimation
Cost estimation is an essential part of budgeting. Your budget probably already includes the direct costs of your organization (salaries, salary-related expenses, commissions, etc.). How about indirect costs? By indirect costs, we mean recruitment, software, and layoff costs. As we were earlier talking about the employee “churn,” recruitment and dismissal become an ongoing cost for your department. Are you including these costs in your budget? For example, if you lose 1/36 of your employees per month within 24 months, your department’s staff has halved (notice how it is not a linear relationship, this is intentional). Have the existing staff’s capabilities doubled? Highly unlikely. If your business is growing and you aim to increase sales departments size, you should first seek to offset the natural employment churn.
Furthermore, here is a small thing that we have come across multiple times. If you aim to hire two new sales staff for your new expanding market, hire four. Two of them will leave within 3-6 months, and the remaining two will be the actual employees that you wanted in the first place.
Comparing Actuals to Estimates
The most crucial part of B2B SaaS sales modeling: identifying pitfalls. Remember, so far, you have made estimations of your future sales. Now it’s time to compare your estimates to your actuals. Track the actuals every month and plug them into your model. Then create 5 – 15 parameters that you follow every month to see how your actuals and estimates compare. It would be best if you did not change your estimates to fit your actuals. Your estimates are your long-term averages, and you should see the parameters as a mean-reverting process. Once you have more data it is time to reconsider if your expectations are correct. At this stage, start by making a few changes to those parameters that you are sure you have estimated wrong. Then gather some new data and see how the model fits.
At first, we do not change the model as the expectation is that nothing has changed since yesterday. However, organizations evolve, and it is unlikely that all the parameters you have estimated today are the same in 5 years. Thus, it is up to you to determine at what point your department has changed so much that it is not the same as before.
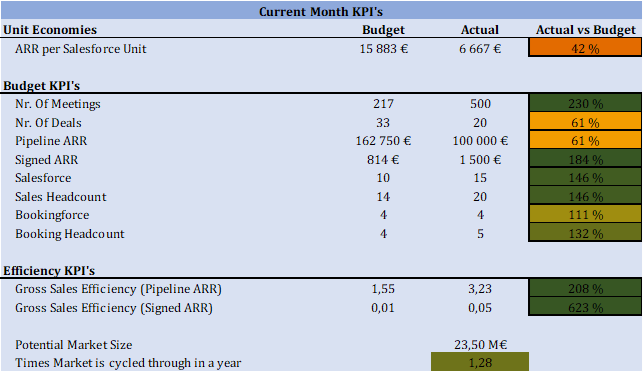
Now that you have some actuals vs. your estimates, it is time to create some monthly KPI’s that you follow. Here is a list of KPI’s that we think are essential to any sales department:
- Number of meetings & deals
- Pipeline ARR & Signed ARR
- Salesforce and Sales Headcount
- ARR per salesforce unit
- Gross Sales Efficiency
- Potential Market Size
- Times market is cycled through in a year (Anything more than 2.5 is way too fast rotation)
Our model
If you wish to have the model or consultation regarding the subject, please send me an email to: Please give us feedback about what is missing and how to improve it further. Even if you think the model is trash, let us know, and we will enhance it further.
We are not going to go through how our model works. It would be a too-lengthy read. Instead, the model provided via email has specific instructions on it. The model contains all the parameters we have discussed in this blog and a bit more. We have included 13 KPIs that we think are essential for any SaaS sales department.
Thank you for reading this far! If you are looking for more subjects that we have written, please check this link.
Author: Sami Aho